食用须知:默认您已使用vue-cli脚手架搭建了一个基本Vue项目,具体搭建方法请google,教程很多。
本文技术环境:
npm -v: 6.4.1
node -v: 10.15.3
vue -V: 2.9.6
echars : 4.4.0
一、 前言
日常开发中很可能会遇到进行数据展示的需求,数据量较小可使用简单的table或自写样式来进行展示,但数据量较大且带有其他要求如筛选功能的话,就需要一些图表库来帮助我们。
下面列举一些常用的图表库供参考选择:
- Echars: https://www.echartsjs.com/examples/
不多介绍了,图表界老大哥,稳得一批。 - v-chars : https://v-charts.js.org/#/
基于 Vue2.0 和 echarts 封装 ,更加贴切Vue开发者的使用习惯,为vue项目量身打造的图表库,图表类型丰富,适合快速开发。 - G2 : https://antv.alipay.com/zh-cn/g2/3.x/demo/index.html
阿里出品,Ng-Alain下的@Delon库中有进一步封装的G2,所以与Angular项目有非常好的兼容,支持词云图。 - Highcharts : https://www.highcharts.com.cn/demo/highcharts
兼容IE6+、具有可交互性和动态实时数据展示、词云图、3D柱状图等
当然还有许多优秀图表库,在此不一一列举。
二、 与Echars整合
在终端输入
npm install echarts --save
等待安装完成后,package.json中会出现:

接下来在main.js中添加:
import echarts from "echarts";
// Vue原型对象绑定:
Vue.prototype.$echarts = echarts;   // 全局注册,项目中直接this.$echarts调用即可。
基本依赖就搞完了。下面生成几个图表demo来演示下:
折线柱状图:
<template>
    <div>
      <div id="demo1" style="height: 250px"> </div>
    </div>
</template>

<script>
    export default {
      name: "chars",
      data(){
        return {
          year    :  [ '2015','2016','2017' ,'2018','2019','2020' ],
          money   :  [ 1000, 2000, 3000, 1500, 2600, 4000 ] ,
          growth  :  [ 1.39, 0.29, 2.62, -1.38, 1.5, 0.59 ]
        }
      },
      methods: {
        drawDemo() {
          const d1Chart = this.$echarts.init(document.getElementById("demo1"));
          let d1Option = {
            tooltip: {
              trigger: 'axis',   // 触发类型;轴触发,axis则鼠标hover到一条柱状图显示全部数据,item则鼠标hover到折线点显示相应数据
              axisPointer: {     // 坐标轴指示器,坐标轴触发有效
                type: 'cross',
                crossStyle: {
                  color: '#cfcfcf'
                }
              }
            },
            legend: {
              data: ['销售额', '增长率'],      // series中根据此数组区分.
              textStyle: {
                fontWeight: 'normal',
                color: '#ff5921'   //legend字体颜色
              },

            },
            grid: {
              left: '20',
              right: '10',
              bottom: '10',
              containLabel: true   //grid 区域是否包含坐标轴的刻度标签,
            },
            xAxis: [
              {
                // name: '年份',  //X轴坐标轴名称
                type: 'category',
                data: this.year ,
                axisPointer: {  // 坐标轴指示器,坐标轴触发有效
                  type: 'line'  // 默认为line,line直线,cross十字准星,shadow阴影
                },
                axisLabel: {
                  show: true,
                  textStyle: {
                    color: '#313235'
                  }
                },
              }
            ],
            yAxis: [
              {
                name: '销售额(万元)',  //坐标轴名称
                type: 'value',      //坐标轴类型:
                nameTextStyle: {     // 坐标轴名称的文字样式
                  color: '#0071ff'
                },
                min: 0,
                axisLine: {               // 坐标 轴线
                  show: true,            // 是否显示坐标轴轴线
                  onZero: true,           // X 轴或者 Y 轴的轴线是否在另一个轴的 0 刻度上,只有在另一个轴为数值轴且包含 0 刻度时有效
                  lineStyle: {}
                },
                splitLine: {               //坐标轴在 grid 区域中的分隔线。
                  show: true,              //是否显示分隔线。默认数值轴显示,类目轴不显示。
                  interval: "0",        //坐标轴分隔线的显示间隔,在类目轴中有效。默认会采用标签不重叠的策略间隔显示标签。可以设置成 0 强制显示所有标签。如果设置为 1,表示『隔一个标签显示一个标签』,可以用数值表示间隔的数据,也可以通过回调函数控制。回调函数格式如下:
                  lineStyle: {
                    color: '#313235'
                  }
                },
                axisLabel: {
                  formatter: function (params) {
                    return "¥ "+parseInt(params) ;  // 可自定义数值显示的格式
                  },
                  show: true,
                  textStyle: {  // 控制Y坐标轴坐标值字体样式
                    color: '#980093'
                  }
                },
              },
              {
                type: 'value',
                name: '增长率',
                max: 10,                  // 右侧Y轴最高值 默认为后端传入数据的最大值
                min:-5,                   // 右侧Y轴最低值 默认为后端传入数据的最小值
                nameTextStyle: {          // 坐标轴名称的文字样式
                  color: '#0071ff'
                },
                axisLine: {               //坐标 轴线
                  show: true,             //是否显示坐标轴轴线
                  onZero: true,           //X 轴或者 Y 轴的轴线是否在另一个轴的 0 刻度上,只有在另一个轴为数值轴且包含 0 刻度时有效
                  lineStyle: {
                    color: "#383838"
                  }
                },
                axisLabel: {
                  formatter: '{value} %',
                  show: true,
                  textStyle: {
                    color: '#313235'
                  }
                },
                splitLine: {                 //坐标轴在 grid 区域中的分隔线。
                  show: false,              //是否显示分隔线。默认数值轴显示,类目轴不显示。
                  interval: "auto",         //坐标轴分隔线的显示间隔,在类目轴中有效。默认会采用标签不重叠的策略间隔显示标签。可以设置成 0 强制显示所有标签。如果设置为 1,表示『隔一个标签显示一个标签』,可以用数值表示间隔的数据,也可以通过回调函数控制。回调函数格式如下:
                  lineStyle: {}
                },
                axisTick: {                 //坐标轴刻度相关设置
                  show: false,              //是否显示坐标轴刻度。
                  alignWithLabel: false,   //类目轴中在 boundaryGap 为 true 的时候有效,可以保证刻度线和标签对齐
                  inside: false,           //坐标轴刻度是否朝内,默认朝外。
                  lineStyle: {
                    color: "#383838"
                  }
                }
              }
            ],
            series: [
              {
                name: '销售额',
                type: 'bar',
                data: this.money ,
                barWidth: '20', // 柱图宽度,
                // 柱体颜色渐变
                itemStyle: {
                  color: new this.$echarts.graphic.LinearGradient(0, 0, 0, 1, [
                    {offset: 0, color: '#913aff'}, {offset: 1, color: '#1868ff'}
                  ]),
                  legendHoverLink: true, // 是否启用图例 hover 时的联动高亮。
                },
              },
              {
                name: '增长率',
                type: 'line',
                yAxisIndex: 1,
                data: this.growth,
                color: '#ffd600',
              },
            ],
            lineStyle: {
              color: '#ffd600',
              normal: {},
              emphasis: {},
            },
          };
          // 使用刚指定的配置项和数据显示图表
          d1Chart.setOption( d1Option, true);
          // 宽度自适应
          window.addEventListener("resize", this.throttle(function () {
            d1Chart.resize();
          }));
        },
        // 监听窗口大小变化在一定时间内只触发一次,避免高频执行
        throttle(fn) {
          let isOpen = true;
          return function () {
            if (!isOpen) return;
            isOpen = false;
            setTimeout(() => {
              fn.apply(this, arguments);
              isOpen = true;
            }, 500)
          }
        }
      },
      mounted() {
        this.drawDemo();
      }

    }
</script>

<style scoped="">
</style>
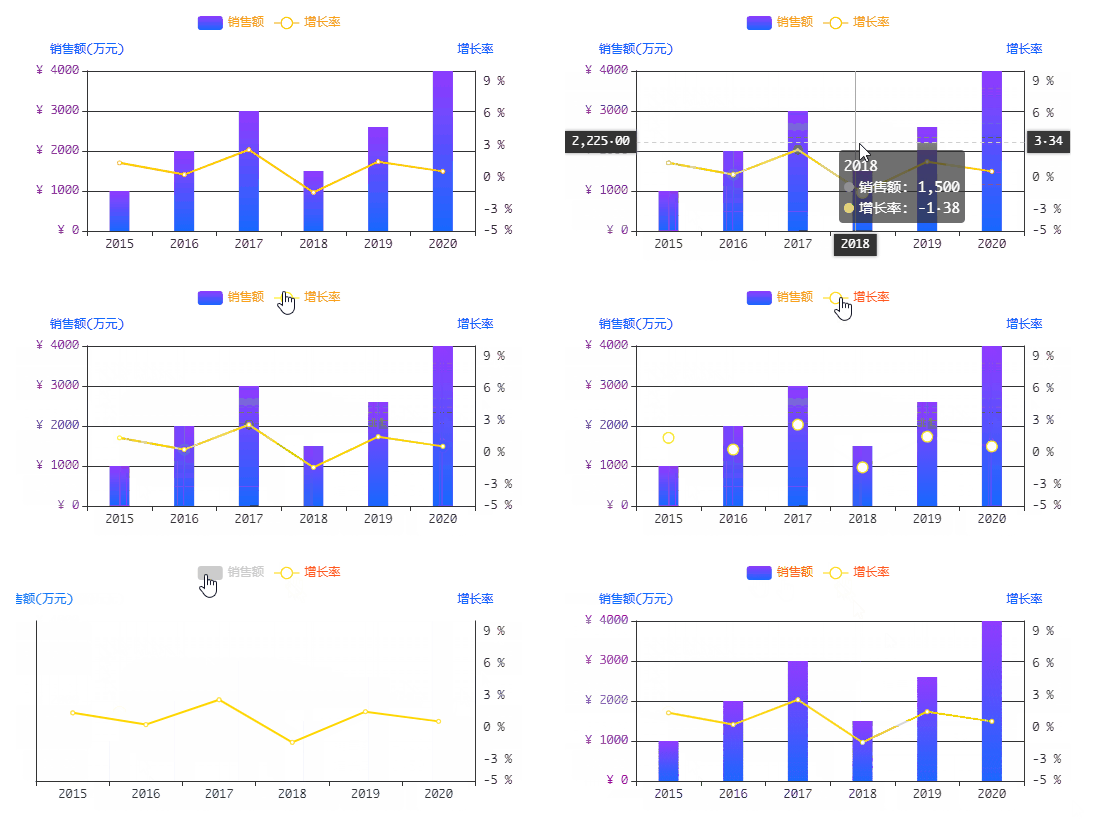
效果如下:

饼图:
<template>
    <div style="padding-top: 50px">
      <div id="demo2" style="height: 250px"> </div>
    </div>
</template>

<script>
  export default {
    name: "chars",
    data(){
      return {
        nvArr  : [
          { value: 5000 , name:'女' },
          { value: 6000 , name:'男' },
        ]
      }
    },
    methods: {
      drawd2(){
        const d2Chart = this.$echarts.init( document.getElementById("demo2" ) );

        // 配置项
        let d2Option = {
          tooltip: {
            trigger: 'item',
            // position:'top',  // 悬浮框出现的位置
            formatter: "{a} <br/>{b}:{c} ({d}%)"
          },
          legend: {
            data:['男','女'],
            padding: [20 ,0 ,0 ,0],  // legend间距
            textStyle: {
              fontWeight: 'normal',     //标题颜色
              color: '#ff5300'
            },
          },
          series: [
            {
              name:'男女人数',
              type:'pie',
              selectedMode: 'single',
              radius: [0, '50%'],

              label: {
                normal: {
                  position: 'inner'  // 文字位置
                }
              },
              labelLine: {
                normal: {
                  show: true
                }
              },
              data: this.nvArr,
            }
          ],
          color : [ '#00e9a3','#ff6f45'], //设置饼状图每个颜色块的颜色
        };
        d2Chart.setOption( d2Option , true );
        window.addEventListener("resize", () => {
          d2Chart.resize();
        });
      }

    },
    mounted() {
      this.drawd2();
    }

  }
</script>

<style scoped="">

</style>
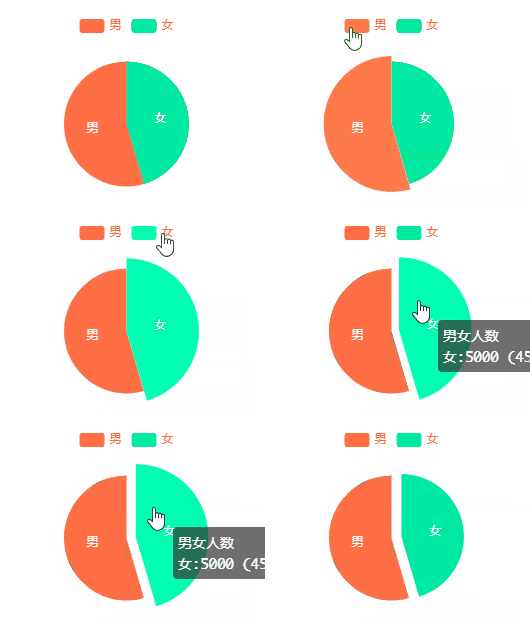
饼图相对简单,效果如下:

动态条形图:
<template>
    <div style="padding-top: 50px">

      <div id="rollingTable" style="height: 300px"> </div>

    </div>
</template>

<script>
  export default {
    name: "chars",
    data(){
      return {
        itemName : [ '厨房用品', '保健品', '礼品', '奢侈品', '户外用品' ],
        moneys: {
          2016 : [ '1000', '5000', '3000', '2100', '8000' ],
          2017 : [ '2000', '2000', '8000', '5000', '6000' ],
          2018 : [ '8000', '4500', '3000', '3400', '4000' ],
          2019 : [ '1500', '1500', '6000', '5000', '8000' ],
          2020 : [ '4000', '2000', '3000', '1300', '1000' ],
        },
        years: [ 2016, 2017, 2018, 2019, 2020 ],
      }
    },
    methods: {
      drawd2(){
        const d3Chart = this.$echarts.init( document.getElementById("rollingTable" ) );
        const option={
          baseOption:{
            timeline:{
              show:false,
              autoPlay:true,
              data:[],
            },
            grid: [{top:'5%' ,left:'10%', rigth:'5%' }],
            tooltip: {
              trigger: 'axis',
              axisPointer: {
                type: 'shadow'
              },
            },
            xAxis: [
              {
                gridIndex: 0,
                axisLine: {show: false},
                axisTick: {show: true},
              },
            ],
            yAxis: [
              {
                gridIndex: 0,
                data: this.itemName,
                axisLabel: {show: true},
                axisTick: {show: false},
                axisLine: {show: false}
              },
            ],
            series: [
              {
                name: '销售额',
                type: 'bar',
                barWidth:'15',
                xAxisIndex: 0,
                yAxisIndex: 0,
                data: this.moneys ,
                itemStyle: {
                  color: '#00b167'
                }
              }
            ],
          },
          options:[]
        };
        for(const item of this.years){
          option.baseOption.timeline.data.push(item);
          option.options.push({
            title:{
              text: item + "年销售额" ,
              textStyle:{
                color:'#595a59',
                fontStyle:'normal',
                fontWeight:'600',
                fontSize:18
              },
              left:'center'
            },
            series:[{
              data: this.moneys[item]
            }]
          });
        }
        d3Chart.setOption( option, true );

        window.addEventListener("resize", () => {
          d3Chart.resize();
        });
      }

    },
    mounted() {
      this.drawd2();
    }

  }
</script>

<style scoped="">

</style>
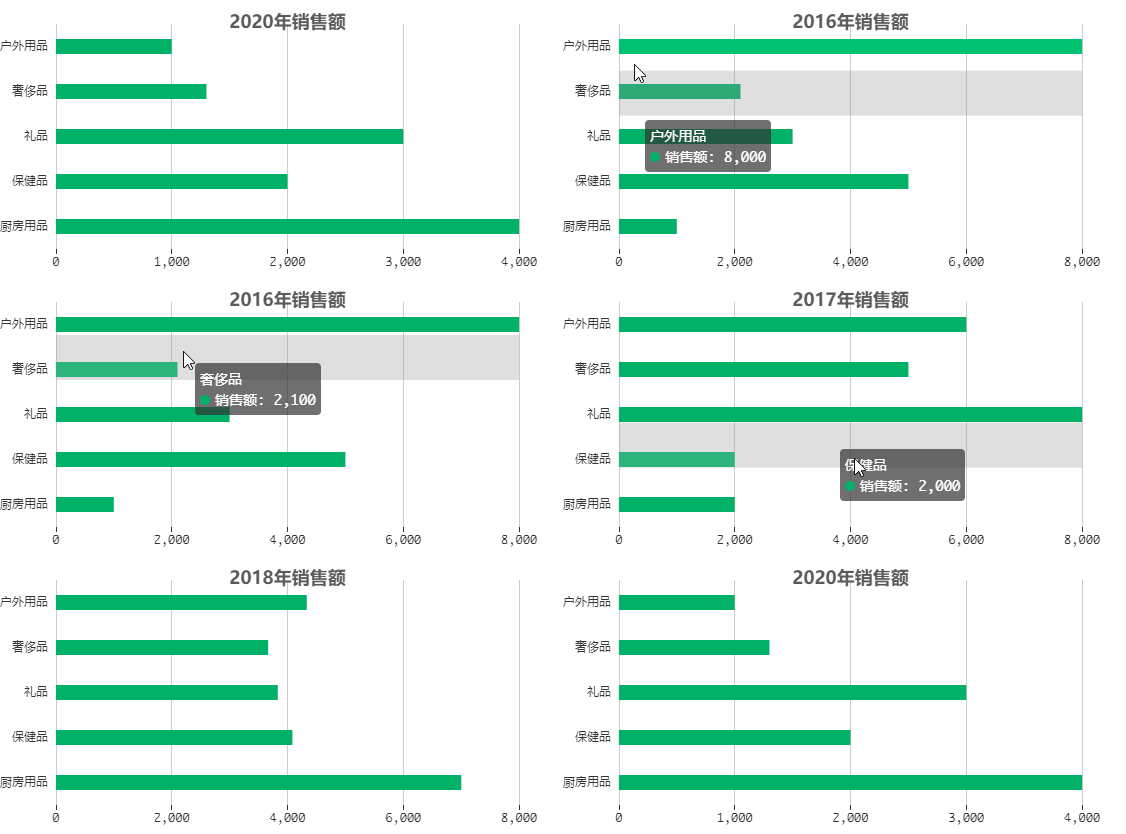
动态滚动效果如下:


